Trying to price a new product on Amazon FBA, you’ll probably hit a wall: your numbers look good in your spreadsheet, but after fees, shipping, and storage, the profit vanishes, or worse, turns negative. Every seller has seen projections collapse after plugging real Amazon FBA fees into the wrong spot or missing a hidden charge. That’s where a fba revenue calculator becomes the line between wishful thinking and a realistic profit plan.
The tricky part is, not all calculators work the same. Some “amazon fba profit calculator” tools only show basic fees and ignore things like long-term storage or category-specific charges. Others use old fee tables or let you skip inbound shipping, which gives you a fake sense of security. If you trust those numbers, you can end up scaling a product that loses money at volume.
What actually matters is picking an fba fee calculator you can double-check against your real COGS, variable shipping, and seasonal Amazon fee changes. Sellers who get this wrong usually find out after they’ve already placed a big order or committed ad spend, and by then, the fix costs more than running a proper fba margin calculator up front. The smartest approach is to treat every new SKU like a fresh math problem, not a copy-paste from your last launch.
Here’s what to check before you trust the numbers.
What Should You Check Before Using an FBA Revenue Calculator?
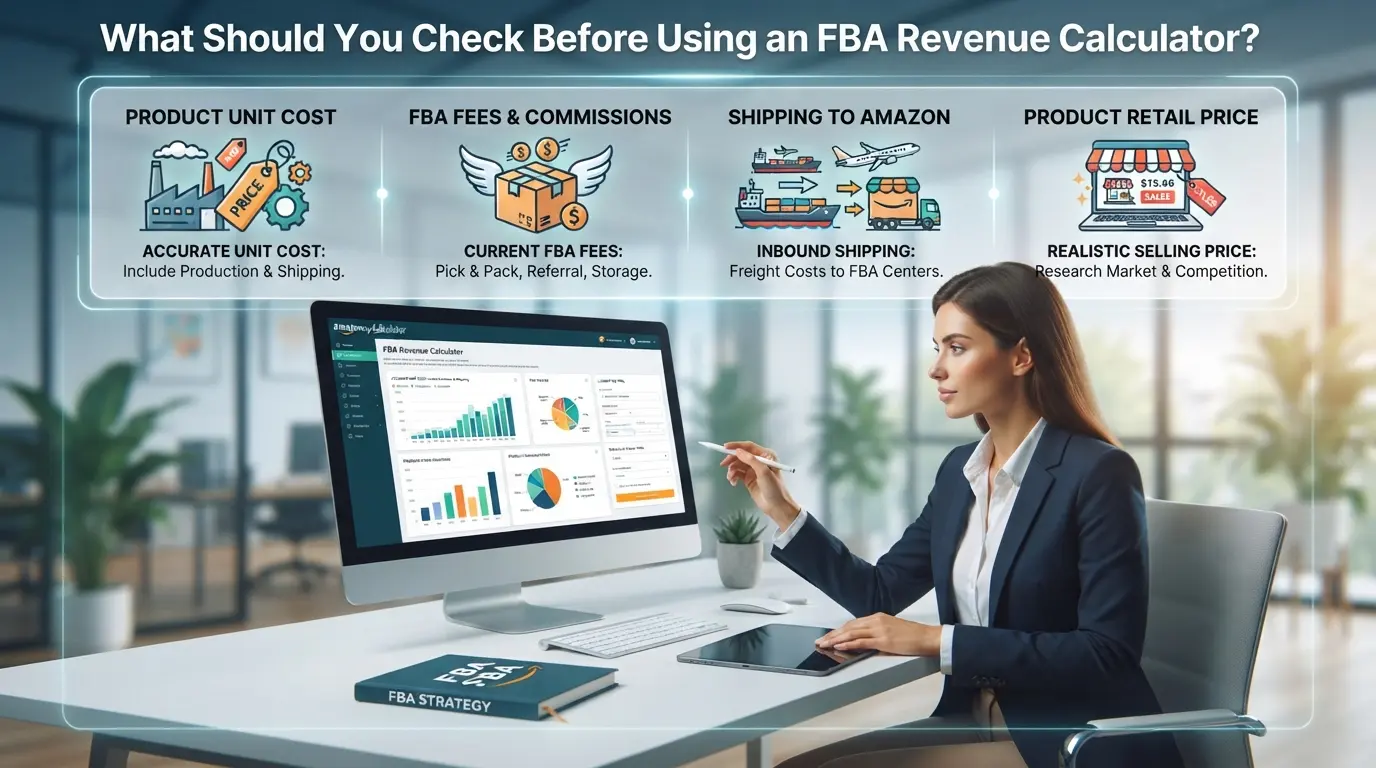
Before you trust the numbers from any FBA revenue calculator, pause and check the data and fee details you enter. Missing one assumption or using last year’s rates can turn a “profitable” product into a real loss once Amazon bills hit.
Why accurate product data matters
A margin calculator is only as good as your input details. If you get the SKU’s weight, size, or even the category wrong, Amazon will charge a different fulfillment fee than you expect. This can swing your net profit by several dollars per unit. The same goes for missing small things like prepping requirements, those costs add up fast.
How fee structures and updates change results
- Confirm you’re using 2026 FBA fee tables, not 2025 or earlier.
- Check for new surcharges (Amazon added inbound placement fees this year).
- Watch for category-specific costs, media and apparel often have extra charges.
Common mistakes that skew calculator outputs
The biggest errors usually show up when sellers use rough estimates instead of real numbers. Guessing at COGS or ignoring returns can make the entire margin look safe, until the first payout is short.
- Enter your actual landed cost, including packaging and prep.
- Add average return and refund rates to see true net margin.
- Include shipping from supplier to Amazon, not just Amazon-to-customer.
If you skip these checks, you’ll spot the gap only after your profits fall short. The #1 fix is to treat every product as a fresh calculation, not a copy-paste from your last SKU, skipping this step is where most sellers lose money without realizing it.
Next, see why even with careful setup, FBA revenue calculators can still give you a false sense of security if you miss changes in Amazon’s real fee structure.
Why FBA Revenue Calculators Sometimes Mislead Sellers
Even solid calculators can miss fees or use bad assumptions, so the risk isn’t just about which tool you choose, but how you interpret the numbers. If you take calculator results at face value, you might end up betting big on a product that only looks profitable on paper.
Hidden fees and seasonal surcharges
FBA calculators often skip seasonal costs and storage spikes. Holiday surcharges and fourth-quarter storage fees can add 15-35% to your expenses. If you don’t factor these in, you could see your profit turn negative just as holiday sales ramp up.
How calculator assumptions differ from real-world operations
Most calculators assume all inventory sells clean, but Amazon deducts for lost items, returns, and refund processing. Shipping rates change month to month, and inbound costs aren’t always fixed.
The biggest trap is trusting static numbers, real operations are messier.- Returns can wipe out projected margin, especially on fragile SKUs.- Safer move: run a sensitivity check. Plug in worst-case return rates and variable shipping, not just “average” values.
If you skip these checks, the calculator can mislead you into launching SKUs that bleed money as soon as the first batch hits fulfillment.
How to Use an FBA Revenue Calculator Step by Step (2026 Edition)
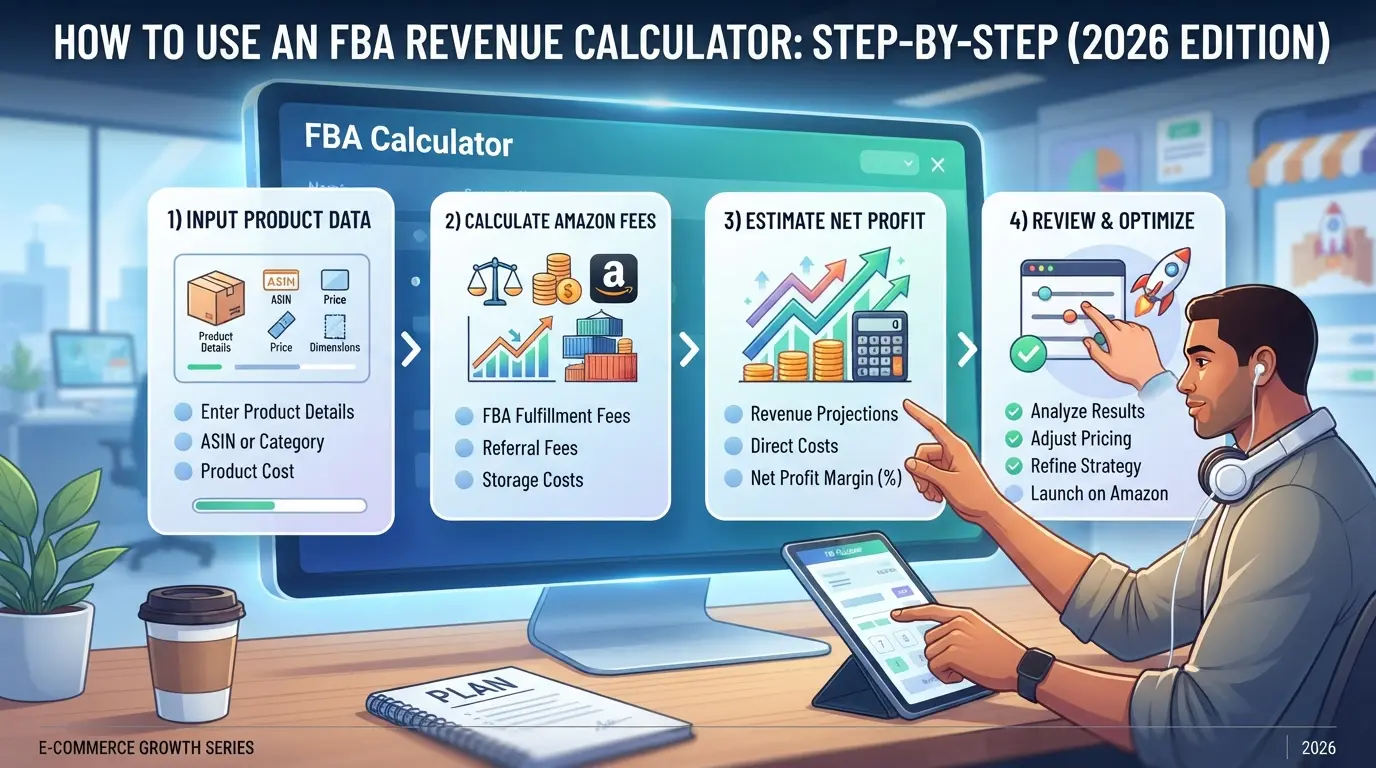
Most sellers just want the real math, how to get a profit estimate that won’t blow up later. Here’s the workflow that gives you reliable numbers and flags mistakes before you commit cash.
Gather product and cost data
- Write down your planned sale price for the SKU.
- List your real COGS (cost of goods sold), not just factory cost, include packaging, labeling, and prep.
- Add shipping per unit, including both inbound freight and last-mile delivery.
- Note any customs duties or import taxes for the item.
If you skip shipping or duties, your margin will look much better than reality. Missing these is why sellers often get burned after launch.
Enter product details and choose fulfillment method
- Input dimensions and weight, this sets your FBA fee bracket. Double-check: Amazon rounds up to the next ounce or inch.
- Select FBA (Fulfillment by Amazon) or FBM (Fulfilled by Merchant) in the calculator. The fee structure changes a lot between these.
- If your product is oversized or odd-shaped, run both FBA and FBM numbers to see which loses less margin.
If you get the size wrong, your fee estimate can be off by $2-6 per unit. For lightweight items, even a half-inch error flips you into the next tier.
Review fee breakdown and profit estimate
- Check all displayed fee categories: referral, fulfillment, storage, and any extra (like returns processing).
- Look for the calculator’s margin and break-even price. If your profit is under $2 per unit, run a second check with 10% higher fees.
- Confirm that the calculator includes seasonal storage or surcharge periods, these can wipe out your margin in Q4.
If the calculator lumps fees as a single line, dig deeper, missing categories are the main reason sellers misjudge their profits. 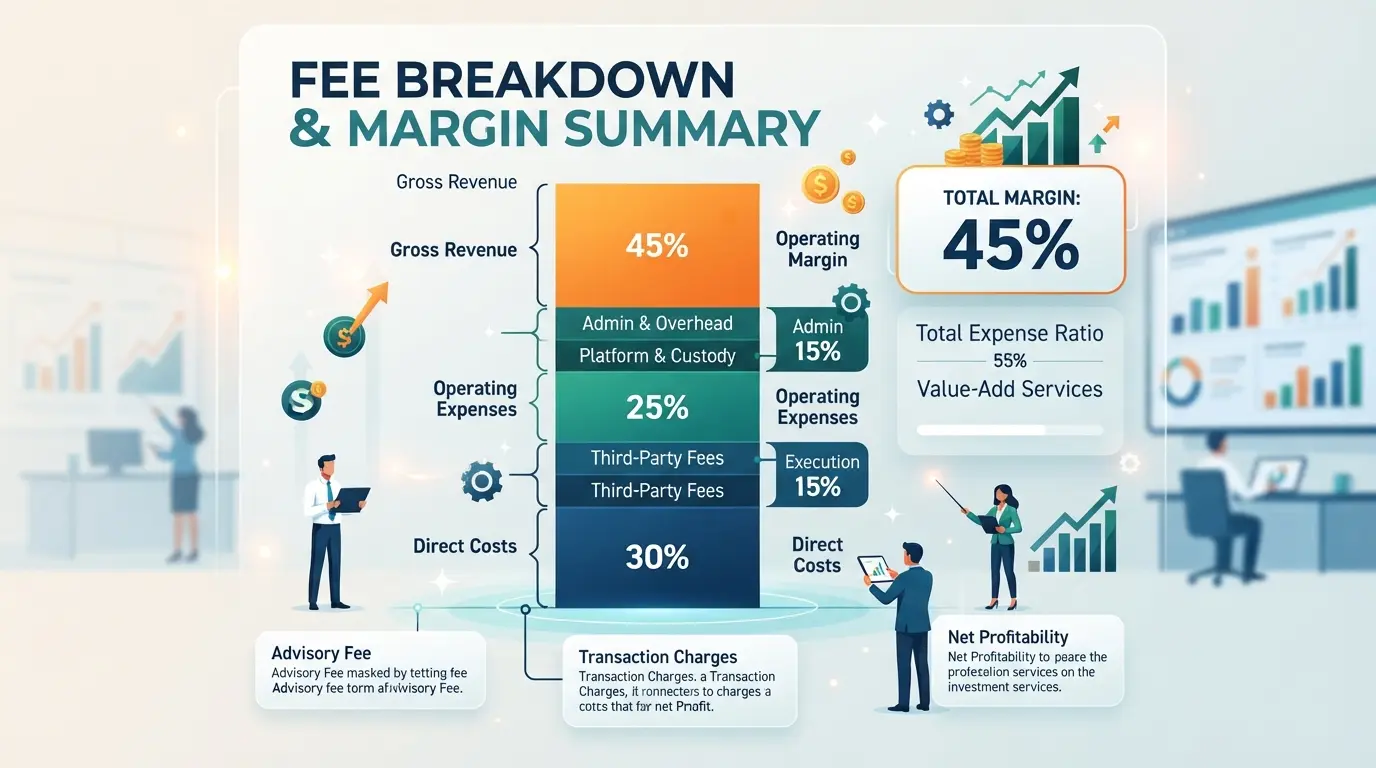
Compare scenarios and adjust for 2026 fee changes
- Toggle fee settings for 2026: Amazon’s FBA fees change each spring, so use the most recent tables.
- Run sensitivity checks, adjust sale price, shipping, or fees by 10% and watch how quickly your margin shrinks.
- Save your scenarios in a spreadsheet. If your margin falls below 7% after realistic changes, it’s usually not worth scaling.
This step stops you from betting big on a SKU that can’t survive fee hikes or shipping delays. Now that you see the workflow, the next step is breaking down which 2026 FBA fees hit sellers hardest.
What 2026 FBA Fees Impact Your Revenue Most?
The fastest way to spot profit leaks is to check which FBA fees have changed for your category, especially if your margins are thin. Not every charge on an fba revenue calculator hits your bottom line the same way, and 2026 brings new twists sellers can’t ignore.
Referral fees and category changes
A lot of sellers miss that referral fee rates shifted in several categories for 2026 (not just the headline ones). Amazon also moved some products into different referral buckets. Here’s a side-by-side for the main variables:
| Category |
2025 Referral Fee |
2026 Referral Fee |
Note |
| Kitchen |
15% |
16% |
New 2026 rate |
| Apparel |
17% |
17% |
No change |
| Electronics |
8% |
9% |
2026 up 1 point |
Source: Amazon FBA fee schedule 2026
Missing a 1% fee hike on a low-margin SKU wipes out profit faster than a $0.10 storage swing.
Fulfillment, storage, and surcharge fees
Peak storage fees now jump in Q4, and 2026 adds a “slow-seller” surcharge for items stored over 180 days. If your calculator only shows monthly averages, you’re missing the spike that hits right before holiday sales.
Returns, refund, and disposal fees
Return processing and disposal fees have quietly increased for several high-return categories. Ignoring these charges in your calculator makes your profit forecast useless for anything in beauty, apparel, or electronics, where return rates can spike over 15%.
If your workflow skips these categories or fee changes, your margin math is off. The next section covers how multi-account sellers can handle these calculations without losing track.
How Multi-Account Sellers Can Safely Manage FBA Revenue Calculations with DICloak
Sellers who run more than one Amazon account, or manage a team, face a real risk of mixing up sessions, leaking browser data, or letting the wrong person access sensitive numbers. Running an fba revenue calculator for each workflow quickly gets messy without a clear way to separate browser storage, proxies, and permissions. For those who need this kind of control, DICloak offers a setup that keeps account operations and profit analysis strictly compartmentalized.
Isolate browser profiles and configure fingerprints for each account
Operators can create a separate browser profile in DICloak for every platform account they handle. This means each account session gets its own browser profile, no shared cookies, cache, or local storage. Fingerprint settings like User Agent, language, and time zone can be configured per profile, so each session starts with consistent, operator-chosen signals. The scope here is limited to browser storage and profile identification; it does not cover anything inside the calculator or the Amazon platform itself. 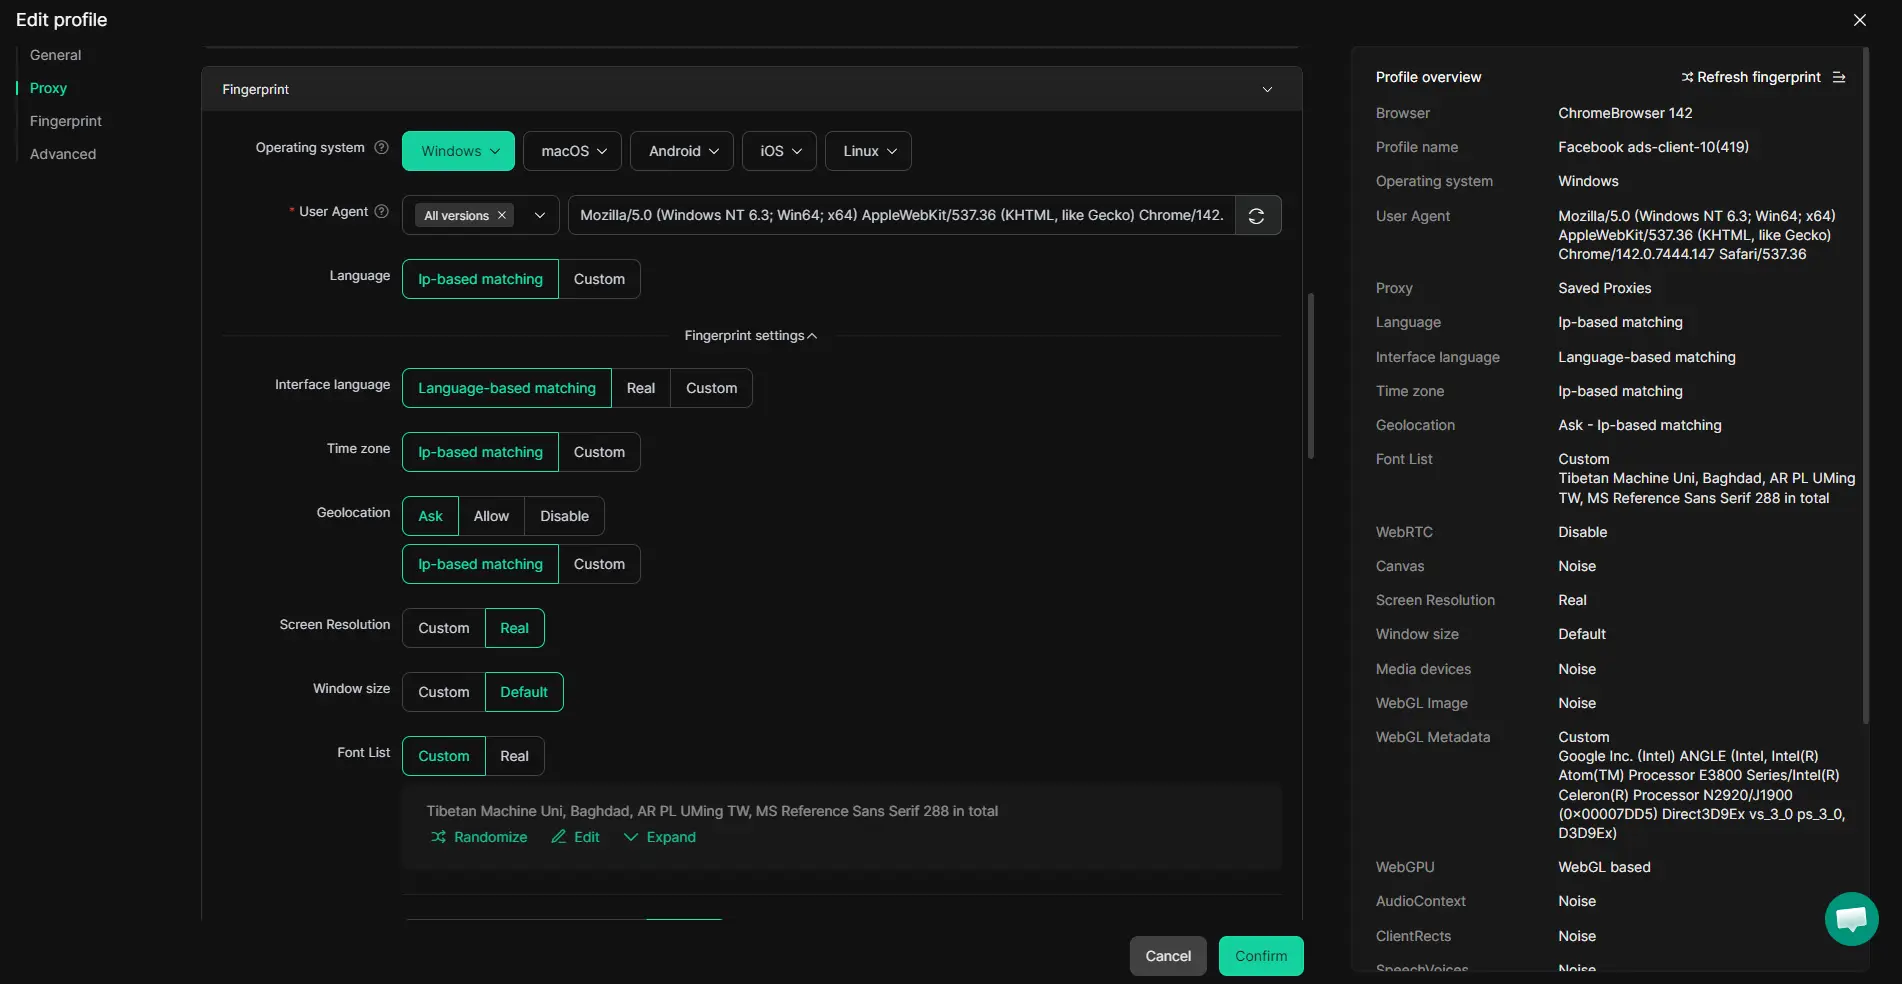
Assign user-provided proxies to each profile for network separation
When workflows require a dedicated network identity, operators can assign a user-supplied HTTP, HTTPS, or SOCKS5 proxy to each browser profile in DICloak. Before opening a session for profit calculations or fee checks, the proxy connection can be tested right in the profile settings. This setup keeps network routes and geo signals cleanly separated between accounts. Remember, proxy choice and quality are up to the user, DICloak does not supply proxies or promise platform outcomes. 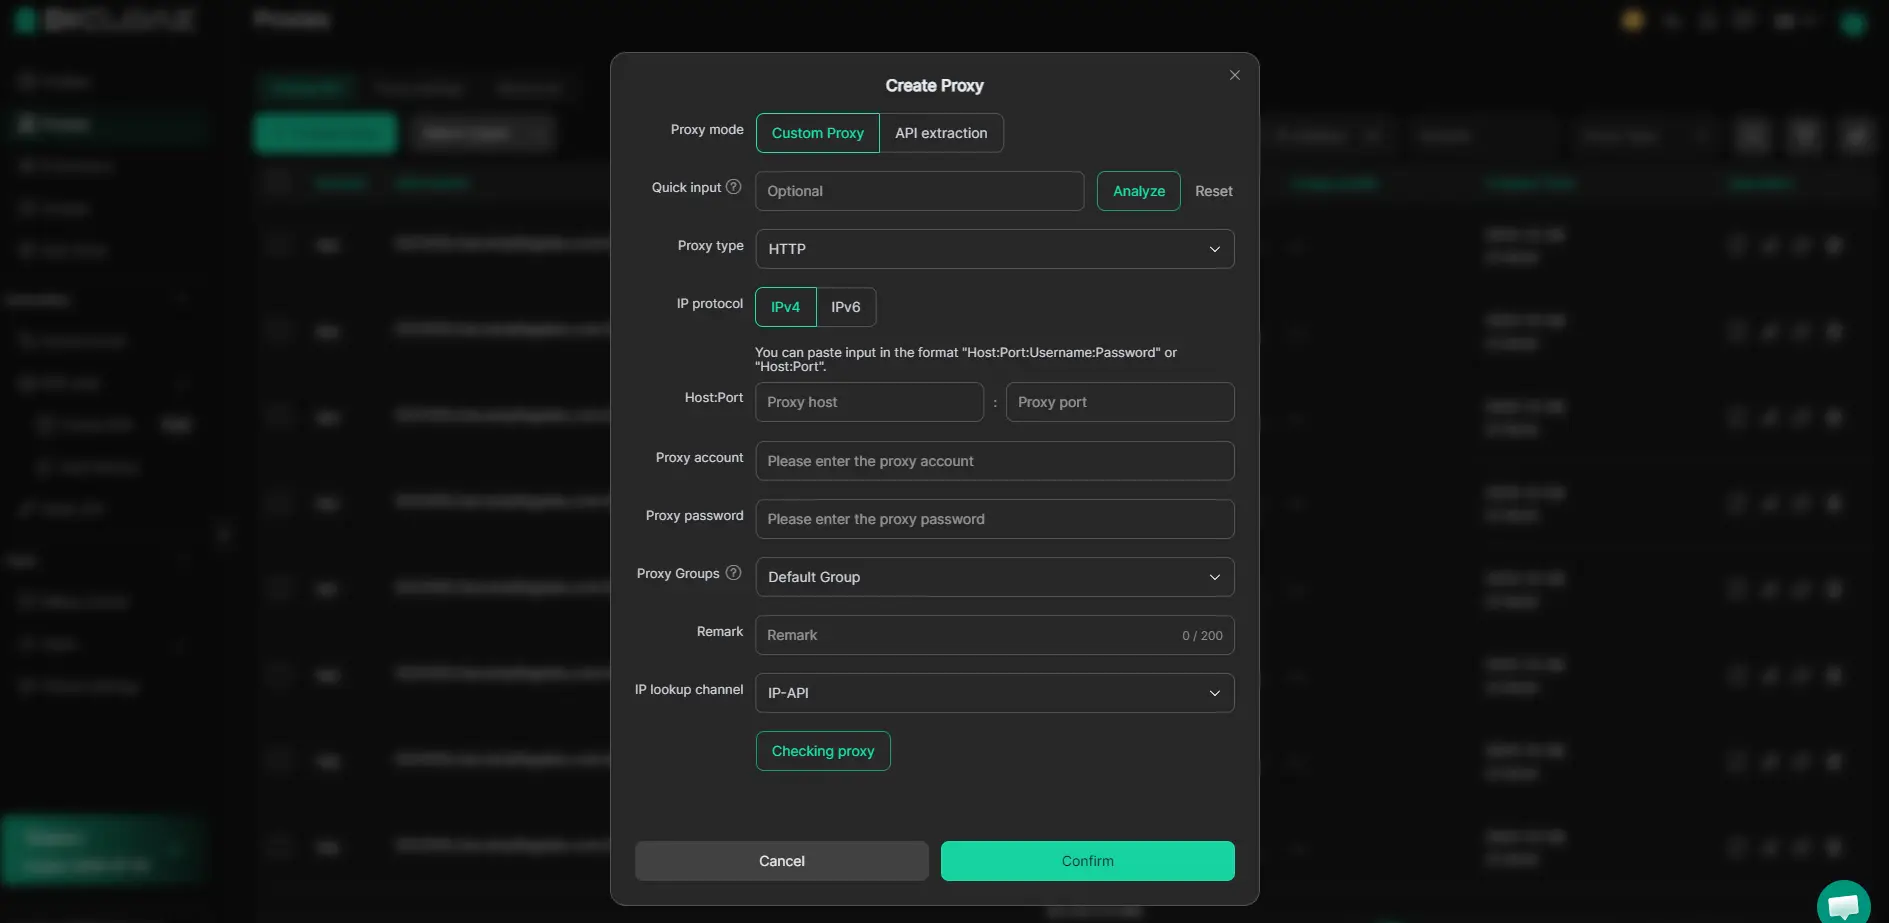
Team Permissions for Assigned Browser Profiles
Admins can set up member groups and assign which profiles each group can see or use inside DICloak. This way, only the right team members can access or edit profiles tied to specific account workflows. For a team handling separate FBA calculations, least-privilege access means fewer mistakes and tighter control over sensitive browser sessions. Permissions apply only to profile access within DICloak, not to the connected platform’s own settings. 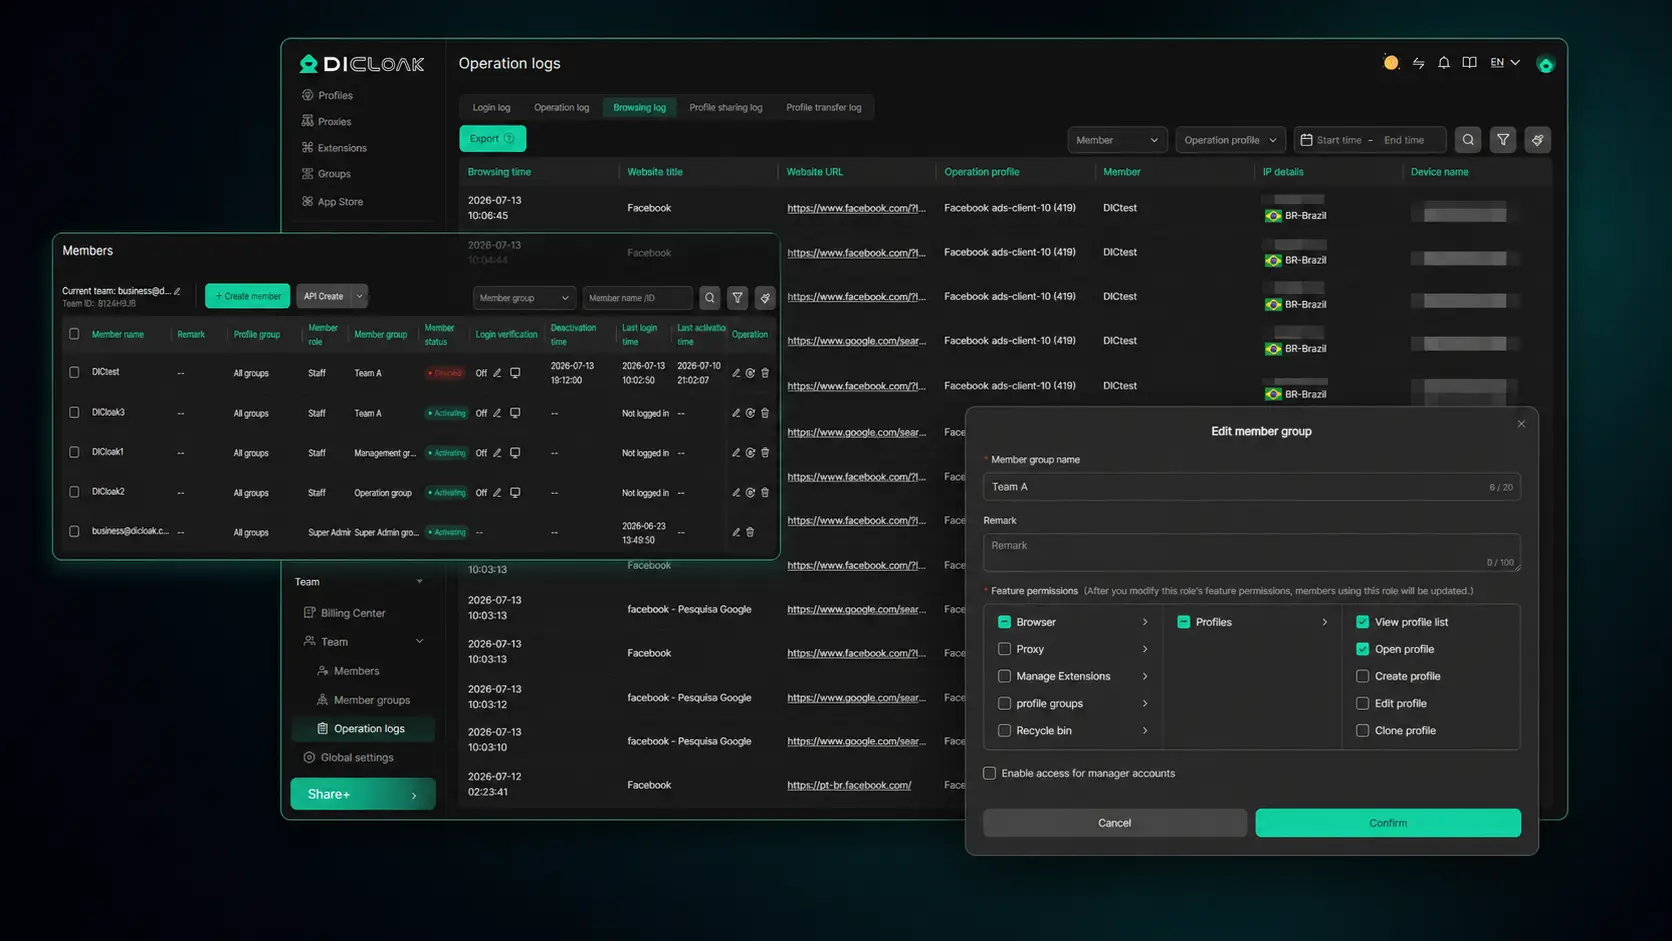
If you want to compare the workflow for FBM revenue calculations, the next section explains the core differences.
FBA vs FBM Revenue Calculators: Which Is Better for Your Workflow?
The right calculator depends on your fulfillment style, if you ship everything yourself, an FBM calculator keeps things simple. If you use Amazon’s warehouses, the FBA calculator is the only way to factor in storage, inbound shipping, and category fees without guesswork.
Key differences in fee structures and workflow
Here’s how the main fee types and workflow steps compare:
| Feature |
FBA Calculator |
FBM Calculator |
| Fulfillment Fees |
Includes Amazon’s pick/pack/storage fees |
Only reflects your own shipping |
| Shipping Cost Input |
Lets you estimate inbound and outbound shipping |
You manually enter shipping costs |
| Workflow Impact |
Requires tracking variable Amazon fees per SKU |
Manual shipping, easier for custom |
Most sellers miss that FBA calculators update fee tables monthly, skipping this can mislead you about margins right before peak season.
When FBM calculators are a better fit
Low-volume or custom sellers get more control with FBM calculators, since you set your own shipping rates and handle fulfillment. If your product moves slow, or you have unique packaging, FBM avoids hidden Amazon fees and lets you keep tight control over cost per order.
If you’re ready to run the numbers for a real product, the next section shows a live calculation for a 2026 home-goods SKU, no surprises, just the actual math.
Worked Example: Calculating FBA Revenue for a 2026 Home-Goods SKU
Sellers often ask how the numbers actually play out when you use an FBA revenue calculator on a real product. Here’s what it looks like step by step for a mid-range home-goods item in 2026.
Input data for a $24.99 home-goods SKU
For this example, imagine a ceramic kitchen organizer with the following details:
- List price: $24.99
- Product cost (COGS): $7.50
- Inbound shipping per unit: $1.60
- Packaging: $0.40
- Weight: 1.2 lbs, fits standard-size
- Fulfillment to US FBA warehouse
Entering these numbers into your calculator, set the category to Home & Kitchen and select standard fulfillment speed.
Output: profit, margin, and fee breakdown
After hitting calculate, you’ll see a results screen that breaks down revenue, total fees, and net profit. The tool subtracts referral fees (typically 15% for this category), the 2026 FBA fulfillment fee for a 1.2 lb standard item, and any inventory surcharges. On this SKU, the total Amazon fees show up as the biggest single cost after product sourcing.
For example, if you skip updating the weight or forget the new 2026 surcharge for certain packaging types, your projected margin can drop below 20%, even though the headline price looks solid. The most common mistake is trusting the default fee presets instead of double-checking every field against your invoice and product spec. This approach lets you spot if a $24.99 item will actually net $3 or barely break even, before you commit to inventory.
| Category |
Example Input |
Calculator Output (2026) |
| Sale Price |
$24.99 |
$24.99 |
| Total Amazon Fees |
(auto-calculated) |
\\\\\\\\\\\\\\\\\\\\\\\\\\\\\\\[shows FBA + referral fees\\\\\\\\\\\\\\\\\\\\\\\\\\\\\\\] |
| Net Profit |
(auto-calculated) |
\\\\\\\\\\\\\\\\\\\\\\\\\\\\\\\[after all costs & fees\\\\\\\\\\\\\\\\\\\\\\\\\\\\\\\] |
Profit Sensitivity: Which Factors Move Your FBA Margin Most?
If you want to know which levers matter most for your profit, the fastest way is to run a series of quick tests inside your calculator. The right adjustments show which costs or prices actually change your bottom line, no guesswork.
Testing price, fees, and shipping scenarios
Use this mini-checklist to see what shakes your margin fastest:
- Adjust your product sale price up or down by $1 and note the margin swing.
- Enter higher FBA fees or new storage charges to see if the margin drops off a cliff.
- Change shipping or inbound freight cost by 10% and check the impact on per-unit profit.
Interpreting break-even and margin sensitivity outputs
A solid calculator will flag your break-even price as soon as you enter all costs. More useful is a margin sensitivity chart, these show how profit shifts if a single input moves. For example, if Amazon bumps referral fees mid-year, you’ll see exactly when your margin turns negative. Focusing on the inputs that move your break-even the most protects you from scaling a product with hidden risk.
Frequently Asked Questions About fba revenue calculator
Can I trust the FBA revenue calculator for all fee changes in 2026?
Most FBA revenue calculators update fees regularly, but not instantly after Amazon changes them. Always check if your calculator reflects the latest updates, especially for new surcharges or fee types. For major changes in 2026, double-check fee schedules on Amazon Seller Central and update calculator settings manually if needed.
How do I handle multiple Amazon accounts when using an FBA revenue calculator?
To keep accounts separate, use different browser profiles or incognito windows. If you want more privacy, set up unique proxies for each account. For team use, assign permissions carefully to avoid cross-account mistakes. This helps you manage profits for each account without data leaks.
Is there a free FBA revenue calculator for 2026?
Yes, Amazon’s free FBA calculator and tools like SellerApp or Jungle Scout offer basic revenue estimates. However, free versions may not include all new 2026 fees or advanced features like bulk uploads. Always check if the tool covers the latest fee changes for the most accurate results.
What data do I need to input for an accurate FBA revenue calculation?
For a correct FBA margin calculator estimate, enter your product price, cost of goods sold (COGS), shipping to Amazon, item dimensions and weight, and product category. These details let the calculator estimate fees, shipping, and profit correctly. Missing or wrong data can lead to inaccurate profit numbers.
How often should I update my calculator inputs for fee changes?
Update your calculator inputs whenever Amazon announces new fees or changes, which often happens each quarter or at the start of a new year. Regular updates help you avoid profit surprises and keep your FBA profit calculations accurate. Set a reminder to review your numbers after each announcement.
Now that you understand how to analyze your product costs and potential profits, take a moment to run your own numbers using a reliable calculator. Accurate projections can help you make smarter choices about your next inventory investment or pricing strategy. Try DICloak For Free
 Web Proxy Tools
 Free Tools
 Cookie Plugin
 UA Generator
 MAC Address Generator
 IP Generator
 IP Address List
 2FA Code Generator
 World Clock
 Anonymous Check
 WebRTC Leak Test
 UUID Generator
 Free Web Proxy Site
 Proxy Checker
 FB Ad Checker
 AI Web Scraping
 Free SMM Tools
 Twitter Shadowban Checker
 Instagram Name Checker
 UTM Generator
 Username Generator
 AI Hashtag Generator
 LinkedIn Headline Generator
 Social Media Image Resizer